Hello Ahmad,
This is not a very clean spectrum but probably has more to do with the technical execution of the test than the API.
You can find spectral data for Daclatasvir here:
orgspectroscopyint.blogspot.com.au/2015/07/daclatasvir.html
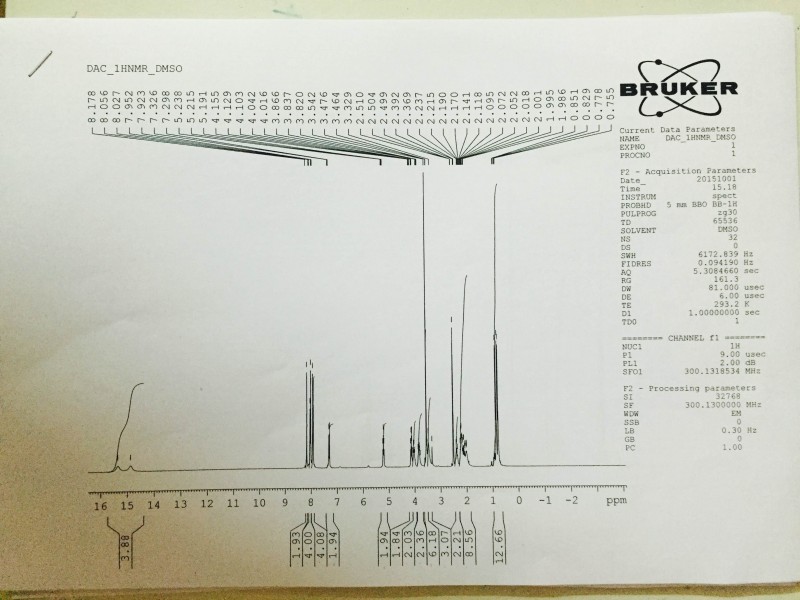
1H NMR (400 MHz, DMSO-έfc, 80
0C): 8.02 (d, J=8.34 Hz, 4 H), 7.97 (s, 2 H), 7.86 (d, J=8.34 Hz, 4 H), 6.75 (s, 2 H), 5.27 (t, J=6.44 Hz, 2 H), 4.17 (t, J=6.95 Hz, 2 H), 3.97 - 4.11 (m, 2 H), 3.74 - 3.90 (m, 2 H), 3.57 (s, 6 H), 2.32 - 2.46 (m, 2 H), 2.09 - 2.31 (m, 6 H), 1.91 - 2.07 (m, 2 H), 0.88 (d, J=6.57 Hz, 6 H), 0.79 (d, J=6.32 Hz, 6 H);
Putting that in an simplified format (first number is ppm on x axis, second is expected y axis value)
8.02 (4 H),
7.97 (2 H),
7.86 (4 H),
6.75 (2 H),
5.27 (2 H),
4.17 (2 H),
3.97 - 4.11 (2 H),
3.74 - 3.90 (2 H),
3.57 (6 H),
2.32 - 2.46 (2 H),
2.09 - 2.31 (6 H),
1.91 - 2.07 (2 H),
0.88 (6 H),
0.79 (6 H);
So if you look at your spectrum you see 12.66 @ around 0.85 ppm - this represents 2 peaks (0.79 & 0.88) merged into one due to instrument power limitations. You can continue on for other peaks, but your spectrum is not great one for teaching NMR basics.
I have attached a pdf showing the impact of concentration on the Daclatasvir spectrum. This was a dilution of exactly the same sample so the only thing different was more solvent. Notice that despite the fact it remained the same API there have been changes to the spectrum.

